Thursday, November 14, 2013

Syntha Pharmaceuticals (NASDAQ: SNTA)

Key Stats:
Price 3.97 TTM EPS -1.17
P/E NA Mkt Cap (mm) 274.8
TTM P/S NA Avg Vol (mm) 1.276
% Short 59.8 Shares Outstanding (mm) 69.05

Price Action:

Writeup:

I typically don't like unprofitable companies, let alone companies that don't have any revenues at all. Thus, when I came across the following words in the most recent 10-Q, I almost put the report down and wrote it off as something that's not of interest: "We have not generated any product revenue and do not expect to generate any product revenue in the foreseeable future, if at all." As someone that believes a stock price's value comes from the discounted future earnings of the company, seeing a line like that is a huge deterrent - but I decided to read on.

Like most small-cap biopharma companies, SNTA burns through cash hoping that their flagship drug in development will make it big-time, in which they'll get bought out by a larger company or use the income stream to expand their product offering and become more stable. Their champion is ganetespib, a Hsp90 inhibitor - meaning that it prevents Hsp90 from doing what its meant to do, which is to facilitate the proper construction and activation of many cancer-promoting proteins. There are many things that make this drug novel: small size so that it can readily pass through membranes larger molecules can't; generality - instead of targeting specific down-the-line targets, ganetespib decreases expression of many of the same targets through targeting Hsp90; low toxicity - though other companies have abandoned similar undertakings due to toxicity and liver damage, ganetespib has proven to be lower toxicity that all the other options, usually resulting in mild diarrhea as its worst side-effect.

SNTA's main trial is the Galaxy-2 Phase III trial for lung cancer treatment as a second line therapy with chemo, which should finish in the 2nd half of 2014 with final results published early 2015. The results from the first trial (Galaxy-1) were recently published and showed that results had worsened over time (moved Hazard Ratio closer to 1.0 - see Appendix). This was due to a disproportionate inclusion of trial patients from Eastern Europe (Russia and Ukraine) late in the trial period, and so the results come on the tail end of the study. These patients contributed to much larger, longer medial survival times, which affected the results negatively. SNTA announced that they're increasing the sample size of Galaxy-2 from 500 to 700, pushing the trial results later into the future, and will not be taking any new patients from the Eastern European countries but will ramp up patient enrollment in the Western countries, where the hazard ratio is much more attractive and the efficacy of the drug is more apparent. If nothing else, this shift in patient demographics should help results going forward.

Another trial started in 2012, ENCHANT-1, is designed to evaluate ganetespib as a first-line treatment for two kinds of HER2+ breast cancer and triple-negative breast cancer (TNBC) (see Appendix). Initial results are expected to be published in December 2013.

In terms of going concern, SNTA burns through roughly $22 million each quarter to fund its operations. That number is expected to go up by roughly $6 million as each new patient in the trial costs around $30,000. SNTA currently has around $54 million to fund operations and has raised another $50 million through a recent share offering (14 million shares @ $3.75/share). This should amount should get them through 2014, where they'll at least have enough to publish interim results from the Galaxy-2 trial and raise more money if there are positive results.

Trade
SNTA is sitting at its 52-week low due to increased trial period of Galaxy-2 and lower efficacy results of Galaxy-1. With initial data from another trial (ENCHANT-1) being presented in December, and management's comments along with industry expert's praise of ganetespib - I believe that the downside is limited. In the case of bad ENCHANT-1 data, I can envision another 5-10% drop - but positive results should push the price up significantly more. Further to that, high short interest and days-to-cover prime the stock for pop-ability. Looking at the technicals, the stock is also oversold and presents a good entry point.

For fundamental/value folks, I would wait until after December results and enter into the stock closer to the initial results of the Galaxy-2 Phase III trial, which should be improved from the Galaxy-1 trial results due to regional sampling. Or - don't get into this name at all. It doesn't create any value due to no revenues and future earnings are too difficult to guess at this point, so from an earnings perspective it should be trading at 0.

If you're in for some quick gains, I would be comfortable entering at this price while price increases due to the stock being oversold and shorts locking profits. I also like the risk/return prospects of the December data for the ENCHANT-1 trials, though I must admit that I have not looked into those results as deeply as I have for the Galaxy trials.

The way I'm going to play it is to write some puts for December 4.0 expiry. The 4.0 puts for December expiry are currently trading at 0.45 - 0.55. I would be comfortable entering into this position in December at $4.00 for a $0.45 premium if I get called, or just pocket the $0.45. The Jan 15 5.0 calls look like a good way to get some exposure to the Galaxy-2 trial results without too much premium. The liquidity is quite low, so I'll be patient and only get in a small size.

Appendix
Hazard ratio (HR) represents the odds that a patient in the experimental treatment arm will experience the event of interest (such as death or disease progression) before a patient in the control arm. A hazard ratio of 1.0 corresponds to no treatment effect, while a hazard ratio of less than 1.0 signifies that the treatment is working better than the control.

HER2+ and TNBC are two major subtypes of breast cancer, accounting for 15% and 20% of new breast cancer cases.

Tuesday, October 15, 2013

Burberry Dividend Arb

A quick note from the Markit News & Commentary team, concerning Dividends:

October 14th


Intraday Alert


Burberry Group plc
GB0031743007 (FTSE 100, STOXX Europe 600)

The company has published its planned payment schedule for the upcoming interim dividend, with a provisional ex-dividend date of December 23rd 2013.

This means that contrary to last year Burberry shares will trade-ex dividend after the December expiry for derivative contracts.

Any market participants rolling-forward last year's timetable are likely to expect shares to trade ex-dividend before the December expiry.

The provisional ex-date for next year's final dividend is the 2nd of July 2014.

Since non-Markit using market participants usually use last year's timetable as an estimate for future
dividend dates, this bit of news provides an arbitrage opportunity.

Burberry is current yielding only 1.83%, paying 29p on a price of 1,512.5p - so it might not be
extremely profitable, but it should be a riskless trade.

The method to tackle this would be in the following manner:

  • Buy the December 2013 Burberry single stock future (pricing in the dividend payment will
    undervalue the future price and thus it will be cheap)
  • Short equivalent shares of Burberry stock
  • Exit on expiration date

Wednesday, April 11, 2012

Neat Little Trading Strategy based on COMPRESSION

Wanna see something cool? (All rights go to Jeff Kennedy for the pictures below)

Why don't you do this: find a stock - any stock. Plot as many moving averages as you can (e.g. 5 SMA, 10 SMA, 30 SMA, etc.), and then see if they compress. If they do, then it means something is about to happen. You may then buy a straddle. Or, if you're really keen on predicting where it will go and think you can determine the direction, make a directional bet. If not, then buy a straddle.


Monday, April 9, 2012

Net Non-Performing Assets vs. Total Non-Performing Assets

Over my time in finance, I've come across many ways of valuing companies - especially banks. From sitting through classes to applying a multiple on pre-tax, pre-provision profits at work, there are countless ways to value and monitor bank quality/profitiability.

One curious descrepancy I noticed recently while working with a dataset of bank data was the difference between net non-performing assets (NPA) and total non-performing assets. NPA is defined as "a debt obligation where the borrower has no paid any previously agreed upon interested and principal repayements to the designated lender for an extended period of time" (Investopedia).

Banks usually classify loans past due into three categories: 30-89 days past due and still accruing, 90 days or more past due and still accruing, and nonaccrual. NPA figures come from the loans past due with nonaccrual status.

The difference between total NPA and net NPA is derived from the FDIC Loan Loss Sharing provision. A brief background of this provision can be found off an investment thesis I've written up:

FDIC introduced Loan Loss sharing into purchase and assumption (P&A) transactions in 1991, with the goals of: (1) sell as many assets as possible to the acquiring bank and (2) have the nonperforming assets managed and collected by the acquiring bank in a manner that aligned interests/incentives of FDIC and acquiring bank. Under loss sharing agreements, the FDIC agrees to absorb a significant portion of the loss (usually 80%) on a specified pool of assets while offering even greater loss protection in the event of financial catastrophe – the acquiring bank is liable for the remaining portion of the loss.

The loan loss sharing agreement primarily covers commercial and real estate loans. The way it worked was that the FDIC absorbed credit losses over a period of time (3-5 years) during which the FDIC reimbursed the acquiring bank for 80% of the net charge-offs (charge-offs minus recoveries). During the shared recovery period, the acquiring bank pays the FDIC 80% of any recoveries on loss share assets previously experiencing a loss. The shared recovery period runs concurrently with the loss share period and lasts 1-3 years after the end of the loss share period.

The agreement also includes a “transition amount” – if losses exceeded this projected amount, the FDIC would assume 95% of the losses and the acquiring bank would assume 5%. This provision addresses acquirer’s concerns about catastrophic losses resulting from limited due diligence time and uncertain collateral values stemming from deteriorating markets.

If you are looking through quarterly filings, be sure you know which NPA you are looking at - total or net. Usually a bank will report one or the other - either only total NPA or only net NPA with a footnote explaining why they chose net NPA. These figures do not mean the same thing, thus inconsisencies arise when running screens and calculations - as it is not exactly an apples-to-apples comparison and there are undisclosed assumptions made which are not published.

Furthermore, I've checked with the major data vendors, and their data does not make any distinction between net and total NPA. XBRL formats record the numbers interchangeably - net as total NPA when available.

If you're interested in learning more about net vs total NPA's, implications, and access to both total and NPA figures for banks that only publish net NPA (no instances I've found where they'll publish only total when they can publish net NPA) - please contact me and I'll be glad to share.

Monday, March 26, 2012

MF Global claims, 90+ cents on the dollar?

As you are probably aware, MF Global filed for bankruptcy on Oct. 31, 2011 after sustaining substantial losses and using client money to pay for losses. In total, $1.6 billion dollars of client money was unaccounted for. Banks are now vying for these claims, with Barclays leading the charge.

What might be surprising at a cursory glance is the amount offered per dollar on these claims. Offers are as high as $0.9125 cents on the dollar for US Exchanges and $0.6625 for Foreign Exchanges. You might think that these banks are sure sticking their neck out to make a relatively small and uncertain return, but there's more than meets the eye.

http://www.reuters.com/article/2012/03/16/mfglobal-customerclaims-idUSL2E8EFBFO20120316

Roughly $3.9 billion dollars have been paid back to the US Exchange customers, equalling about $0.72 on the dollar of the claims. Furthermore, there's a plan for a distribution of $600 million in the next two months, another ~$.11 on the dollar.

Thus if you are offering $.90 on the dollar, you are really paying 18 cents (.90-.72) to receive 28 cents (1.00 - .72). Factor in a distribution of 0.11 cents on the dollar in the next two months, and with a couple assumptions the IRR looks pretty sweet. Even if you're not going to get 100 cents on the dollar, that is still a great return.

Another point that many people bring up is that if you're a big bank sitting on a pile of cash that was paid to you from MF Global, you:
  1. Know where the missing money is
  2. Will be forced to pay it back, so you might as well make some money in the process

After you buy up all the claims at $.72, take a look under your seat and find x millions of dollars from MF Global. You gladly return it knowing that it'll come right back to you.

I think it's a solid trade and the banks prove yet once again how clever they can be.

Thursday, March 22, 2012

What Happened to TVIX?

This write-up is based on a Seeking Alpha article I read by Paulo Santos. He hit the nail right on the head with his analysis, and today’s 29% drop can be explained by his investment proposal.

First, we have to ask, what is TVIX?
TVIX is an Exchange-traded note (ETN), a debt security issued by an underwriting bank that tracks a particular benchmark/strategy. In this case, the bank is Credit Suisse and the benchmark is 2x the VIX. TVIX is meant to be a short term holding, as if you read the prospectus, you come across this statement:
“As explained in “Risk Factors” in this pricing supplement, because of the way in which the Closing Indicative Value of the ETNs and the underlying Indices are calculated, the amount payable at maturity or upon redemption or acceleration is likely to be less than the initial principal amount of the ETNs, and you are likely to lose part or all of your initial investment. In almost any potential scenario the Closing Indicative Value (as defined below) of your ETNs is likely to be close to zero after 20 years and we do not intend or expect any investor to hold the ETNs from inception to maturity.”

An ETN usually tracks closely to its Net Asset Value (NAV), the value of the underlying futures that the issuer holds (though the ETN doesn’t own it). The catalyst to the break in TVIX not tracking its NAV was Credit Suisse’s suspension of issuing new units of TVIX. This breaks the no-arbitrage rule, as the supply is gone. The usual supply is from the issuer (Credit Suisse), when it issues the shares at NAV and collects fees, Authorized Participants (AP’s) then make money by selling it at market prices when they’ve created it at NAV cost. They keep selling until the market price tracks closely to NAV again (re-establishing no-arbitrage).

However, when there are no shares to be sold, then the ETN trades like a closed-end fund. A closed-end fund usually trades at a huge premium to NAV due to the difficulty of finding shares to borrow. Paulo noticed/mentioned this when the premium was 18.3% greater than the underlying. Before it reverted back towards NAV levels today, the premium had gotten close to 80%.

The reversion could probably be due to people becoming aware of the mispricing, leaked information about new issuances, hedge funds wanting to take profits, etc. Lots of reasons on why it could revert, it was only a matter of time before it would.

In the future, when you are considering trading in ETFs/ETNs, be sure to read the prospectus and take a look at the underlying.

TVIX Prospectus:

Here's a nice picture mapping TVIX to it's intrinsic value (NAV):


Chartist Friend from Pittsburg's graphs


Wednesday, March 21, 2012

Thanks Jim Montier for this pic


Analysts expect profit margins to continue their incredible rise. Though on a P/E basis I agree that the market is not overvalued, this chart certainly grabs my attention.

Monday, February 20, 2012

Cointegration

I recently listened in on a Mathworks seminar about cointegration and tests used to determine if cointegration exists. I thought the best part was providing a sample trading strategy based on divergence and eventual convergence of cointegrated stocks - and how they used various tests to create indicators for the day-trading time horizon. I've always been a more long-term oriented investor - but I do see the need shift to shorter-term strategies, especially in this headline-moving market.

I will definitely delve into this area some more and share some of the trading ideas I come across along the way.

Wednesday, January 18, 2012

Long shorted names?

YTD, most-shorted names up 5.8% vs Russell 3k's 4%.

Decent strategy might be to long the most shorted stocks and hedge with some OTM VIX calls or OTM S&P puts.

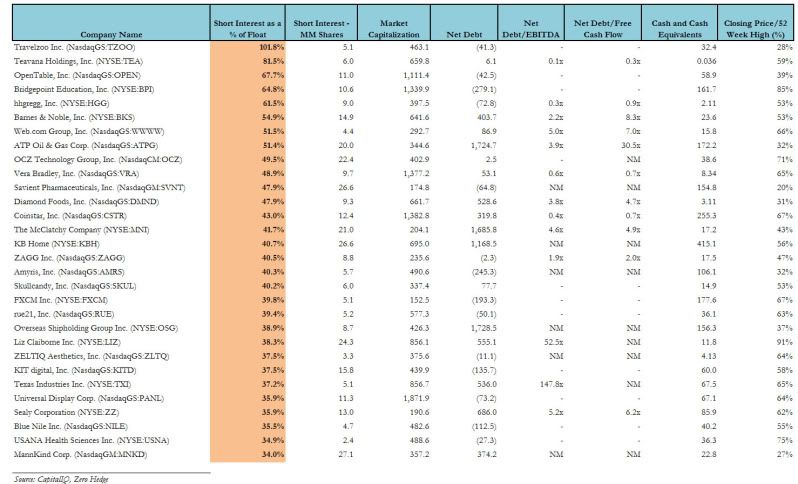
Here's a list of the most shorted stocks thanks to CapIQ

Photobucket

Monday, January 2, 2012

The 5 questions of 2012

Happy 2012. 5 key questions to ponder as this year progresses:

  1. Will US growth be greater or less than consensus?
  2. How much will the Eurocrisis subtract from US growth?
  3. Will US housing bottom in 2012?
  4. Will there be Fed easing? Where?
  5. Will inflation be higher or lower than Fed target?

Happy trading.

Tuesday, November 1, 2011

Portfolio deconstruction

Here's a quick look at my portfolio as of now:

~30% in cash - looking for short term plays and liquidity when the volatile markets swing in my favor

~ 30% short Europe - through ETF's / put options

~5% short the Euro/USD - Euro has had it's run up, expecting low 1.3x by the end of the year on nothing good coming out of the Eurozone.

~10% physical silver - PM's are a great store of value.

~ 25% pot pourri of hand-picked stocks that are underweight utilities and overweight non-cyclical goods & services. Net short on financials.

Plan on playing more broadly as this market is definitely headline driven. Watch out for news out of Europe, and for God's sake stop buying on the rumor and selling on the news. All positive news out of Europe coming from FT.com or The Guardian is utter nonsense, and nothing is credible unless an official is willing to put his name behind it. The half-life of rumors has died down considerably, but that hasn't helped market volatility.

If you want you can try and be nimble and take a quick profit off rumors & their subsequent refutation, but that depends on your risk appetite. Mines is currently smaller than usual, and I am looking for more convergence trades and obvious mispricings (VIX @ 25?!).

Happy trading.

The Big Three

Forget Greece for a second. Forget Italy. Forget the individual countries, and let's look at Europe more systemically. There are three issues that seem to be good flag posts for the ongoing crisis, and there can't seem to be a solution that solves all three. Addressing two of the three issues seems to starve the third of much needed attention.

Those three things are:
1) Bank solvency
2) Sovereign stress
3) Bank funding

It's interesting how when addressing bank funding and bank solvency (naked CDS/stock shorting ban), the sovereign risk seems to have blown out.

Over the next three years, ~$1.7 trillion worth of debt needs to be rolled out (either paid or kicked down the road with the issuance of new debt). An EFSF levered 4x-5x will not be able to cover such an amount, not to mention the bank recaps and continual buying of securities. A number closer to $2 trillion would be needed... but seeing as how bond auctions can barely get covered in Europe as it is now, all with extremely high yields, it does not seem like this problem is shrinking nor solved.

Wednesday, October 26, 2011

A Deal!

Yay! The Eurozone is saved!

Private investors have agreed to a 50% haircut on their Greek debt... but is it really a 50% haircut? As ZH reports:

  • Greece has €350 billion in total debt including about €70 billion in Troika "post-petition" loans; these are untouched.
  • Of the €280 billion, roughly €75 billion is held by the ECB: this, like the Troika loans, will be untouched.
  • This leaves just ~€200 billion in actual debt to undergo a haircut.
  • Apply a 50% haircut to this debt (ignoring the fact that of this about €35 billion is held by Greek pension funds, and once the realization that Greek pensions have been cut in half dawns upon the population, the result will be the biggest riots ever seen in Athens yet).
  • Total debt to be cut: just about €100 billion.
  • Hence, of the total €350 billion, just €100 billion is eliminated, most of it used to backstop and service Greek pension and retirement obligations
  • €250, or the residual, of €350, the original, means 72%, or a 28% haircut.
  • Greek GDP was €230 billion on December 31, 2010 and declining fast.
  • And that is how a 50% haircut is "cut" almost in half

The real question is... how is this going to affect the banks that are holding on to massive amounts of Greek debt? Many of them are currently under review for credit downgrades... this will only be fuel to the contagion fire.

Sunday, October 2, 2011

Opportunity Knocks

Another great chart by ZH.

What can you do with this chart? The possibilities are endless. Let me give you some background first.

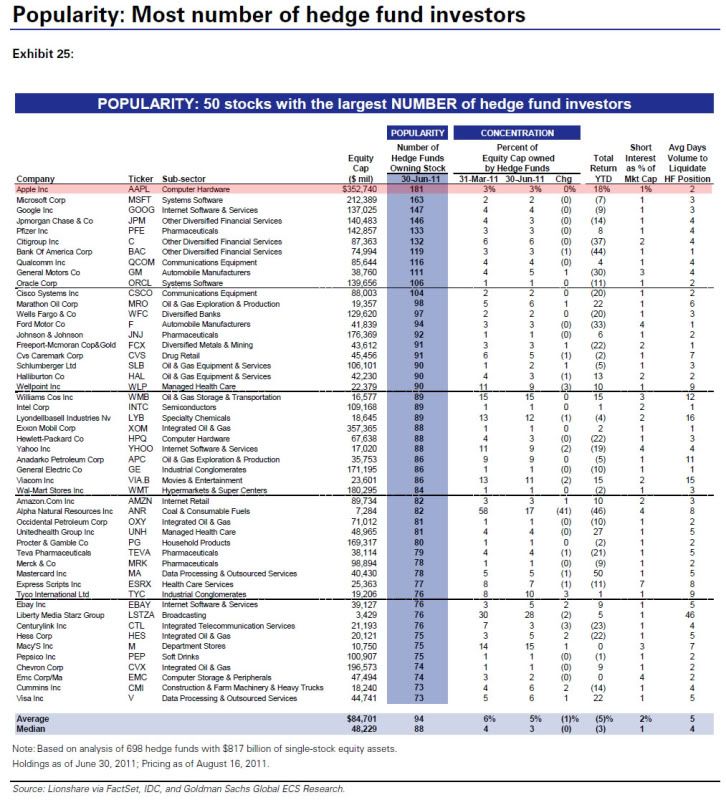
This past Friday(9/30/2011) was the last day of the quarter, as well as the last day for redemptions to be filed with hedge funds. Because of the volatility of the marketplace recently, fear is drowning out greed as people are moving their risky assets to safer ones as well as hoarding cash. This means that a good amount of people want out of hedge funds, and would prefer safer investments like Treasuries (beware of Treasuries - read a couple posts below). With redemptions comes the need to raise cash to pay back to investors. Thus comes the power of this chart.

Photobucket

Using your own methods, you can decide what stocks will probably take a hit while hedge funds are trying to raise cash and dump stock. Realize that multiple funds will be wanting to get rid of overlapping positions, and there is a first mover advantage to this (higher exit price).

Some things worth considering are:
  • Size of positions in stocks
  • Liquidity of stocks (use the higher liquidity ones as a signal of selling - then short lower
    liquidity stocks)
  • Past returns (hedge funds would prefer to book profits rather than cut losses - sell stock that have had positive returns as opposed to writing off losses)
I'll let you come up with your own strategy, as I have my own. I'm providing you the tools and train of thought to profit from this, please take advantage and also bounce ideas around with me.

Risks:
  • Hedge funds might sel off some of one stock, but not the one you short
  • Game Theory - Anticipate moves and counter them before-hand
  • Liquidity - Hedge funds might not liquidate stocks that take a while to get rid of
  • Dark Pools - stocks get traded off the exchange among diff funds, usually in big blocks

My guess is that there will be a lot of mixing in the dark pool, most likely at discounts that will be somewhat reflected in the price. Use quickly liquidated positions as signals for slower liquidation stocks. Stay alert, do your homework, check out implied volatilities - take advantage of cheap options.


There's a rough road ahead, let's take advantage of it!

Friday, September 30, 2011

CORN-Y

There was an article in ZH today talking about how corn futures stopped trading for the day due to massive price movement:

"Back in April, when we first discussed the hike in daily corn trading limits from $0.30 to $0.40, we had some cynical observations, namely that "inviting not only more vol (read bottom line for the business) but more margin, the CME is exposing speculators to far greater impacts from margin hikes (and drops). Which of course means a far great capacity and ability to kill any commodity rally dead in its tracks." Well, there is no margin hike today (yet), although based on today's action we fully expect one. The reason, we are currently at today's down 40 cent limit, a price of $5.925 a bushel, the lowest since July 1, and by the looks of things it will get far worse: as the chart below demonstrates right now sellers outnumber buyers by a ratio of 2000 to 1. Expect this ratio to get even bigger once the CME hikes corn (and who knows what other commodity) margins as soon as today."

With this information, I did some really really quick research and came up with a trade.
My trade thesis is:

1) With the 40 cent limit being hit (so much more selling interest compared to buying), a potential margin hike due to crazy volatility, and the retreat from commodities into cash... my guess is that corn futures prices will probably gap down again at the open.


Here is the graph of CORN, an ETF that follows the price of corn futures. If you look the last bar chart is the price movement today, and the 2nd to last is the price movement yesterday. Look at that huge gap down. I definitely think that if nothing else comes out of this, there will be a margin hike that will force selling of corn futures, lowering the price of them... lowering the price of CORN, putting any shorts in the money.

Vermont-based Teucrium Trading LLC

Teucrium Corn Fund ETV (CORN)

Like most commodity ETFs, CORN will achieve exposure to the underlying commodity through futures, in this case contracts traded on the Chicago Board of Trade. But unlike a lot of products out there, CORN won’t invest exclusively in near month contracts; assets will be split between second-to-expire futures (35%), third-to-expire futures (30%), and futures expiring in the December following the expiration month of the third-to-expire contract (35%).


There are many risks to consider in this trade, here are a few of them:
  • CORN price tracking with corn futures price. (Considering this ETF is based on multiple corn futures contracts, this risk seems very small)
  • Rise in the price of corn futures. Very possible with such a large gap down. This of course is the biggest risk.
  • Settlement dates interfering with prices. The settlement date just passed (in Sept), and if you look at the ETF's composition, it appears that the any movement in settlement is largely offset by the proportion of long-term contracts.
  • Counterparty risk. Who is Teucrium Trading? They have multiple commodities ETF's and look to be a pretty solid company. Besides, if you're shorting...


Good luck and happy trading.

Disclosure: I am currently short CORN.

Thursday, September 29, 2011

Why You Should Short Bonds

There are three reasons why bonds would have a great return if you short them. They are as follows:

  • The credit risk of most bonds (including sovereign bonds) is high - especially compared to their respective ratings.
  • Interest rates are currently artificially low, and when they eventually rise - prices will fall (bond yield and price have inverse relationships).
  • Bonds are denominated in currencies. Currencies, such as the USD, will lose a lot of value in the coming times (due to Keynesian monetary policy).

All these ideas are from Doug Casey, and he has a proven track record of being right on the condition of the economy and where it's headed.

Wednesday, September 28, 2011

Words of another

Here are some choice words from Rich Fisher, president of the Dallas Federal Reserve Bank, talking about the aftermath of Operation Twist:

Jan Mayen is a desolate volcanic island located about 600 miles west of Norway’s North Cape. It is the home of a meteorological and communications station manned in the harshest of winters by 17 hearty members of the Norwegian Armed Forces. If you read Tom Clancy’s Hunt for Red October, you would know it as “Loran-C,” a NATO tracking and transmissions station. In the video game Tomb Raider: Underworld, Lara Croft visits Jan Mayen in search of Thor’s Hammer, considered the most awesome of weapons in Norse mythology, capable of leveling mountains and performing the most heroic feats.

My brother Mike recently visited this station on Jan Mayen. This is the sign that greeted him.

In Norsk, it reads as follows:
“Theory is when you understand everything, but nothing works.”
“Practice is when everything works, but nobody understands why.”
“At this station, theory and practice are united, so nothing works and nobody understands why.”

Monday, August 29, 2011

Winning/Losing in the markets

Hi guys,

It's been a while since I posted, but as this is towards the end of the month... I thought I would review some of the trades I've made this month as well as provide some insight going forward.

I started this month down 30% because I got caught up in earnings announcements and decided to play a lot more earnings with a lot more capital than I rationally should have. I did not do my homework and decided to account for that by placing successively larger bets to account for my losses. In short, I began to gamble a lot. Trying to recoup losses when your portfolio was +20% for the year at mid-July really does have the psychological effect of grabbing at any string that presents itself to lift you out of the hole. Little did I know that most of the strings just had me falling further into the hole. Now that I've learned the hard way with little capital, the same reminders will come up in the future when I am investing with larger capital.

This month has been slightly different. I have stopped playing earnings (sans HPQ - which I will discuss in a future post). I decided to do a lot more reading and painting a larger macro picture and investing in broader trends rather than specific companies. As I read, I realized that even a great company in a horrible sector can lead you to bad outcomes. Thus, macro matters first, then back out the sector performance, then finally companies. Top-down approach.

One big bet this month has been the Eurozone. I have been reading significantly and following religiously on the Eurozone crisis. I have read about Merkel and Sarkozy so many times that I do literally see "Sarkozy" when they are mentioned together. That led me to short EWI and EWP at the beginning of the month. The playing out of the dramatics and the implementation of the short-sale ban has led me to take a few profits, but mostly to stay in the position - as it has really great returns, limited downside, and a great risk/reward ratio for the upside. Thanks to these two plays, my portfolio has rocketed back upwards and is in positive territory again.

Another one of the plays I've been in and out of has been gold. Instead of buying paper/physical gold, I have been investing in gold companies. The main position I like to play is the Canadian company, Yamaha Gold (AUY). They are a well managed company that usually does a little better than gold, while dropping a little less on dips (worth exploring compression trade soon).


Gold has performed marvelously over the past couple of months, and through my outlook still has some upside to it, though there might be a near-term correction. Monetary policy by printing and Eurozone worries keeps AUY in my port.

Another precious metal (PM) worth looking into is SLV. For lack of a good company with solid fundamentals and good management, I just hold the ETF. Silver had a sneaky run-up but for the most part has sold off due to possible margin-hikes and "risk-off" sentiment. I am still a holder as I feel market participants are pricing in further easing and blue skies when all the data suggests otherwise.

As for my outlook - I have just summarized it. Correction is imminent, it just depends on when. There have been multiple multiple low-volume days where the market just floats up on short coverings and High-Frequency shops running up the bids. All of last week was relatively light volume days. This week will further be light volume, sans some crazy announcement, until Friday's non-farm-payroll numbers, which IMO aren't going to look pretty. Many Federal Banks have already shown their numbers about a faltering and slowing economy... and how the Q2 GDP report could cause a 2%+ rally in the markets is anybody's guess (Don't tell me Ben's leaving the door open is the cause - QE3 had slowly been priced in during the week off bad numbers on Monday).

Europe is not looking any better. There are lots of liquidity issues going on in banks, and questions about insolvency are still lingering. CDS spreads are very wide and have lowered a little bit, but expect more widening to come. I have become a proponent of using CDS spreads as proxy for stock performance, as I think that bond-holders usually have a better gauge of the company's financials than equity holders. If they are buying insurance to cover their bonds, and the spread is going up... equity holders should be wary. While bondholders still might get back 80 cents on the dollar, equity holders get NOTHING. If CDS spreads continue to widen (which I believe they will due to liquidity constraints and ineffective leadership), look for further negative market reaction. For the limited upside on the Eurozone, it will take a long time for them to get things in order - and that will most likely require a new leadership, as current leadership (Merkel) is not likely to get the support needed for EFSF, and even if she does it's over for her political career. No one cares about the IMF apparently, as Lagarde's harsh words on the current state of affairs in Europe and US led to a world-wide rally in stocks, with greater than 2% gains in European indices.

I will end with BAC. Are they in trouble, or are they not? Apparently new facts appear every day, and I have differing views with people I deem smarter and more knowledgeable in the banking industry. I think that their settlement will ultimately cost more than $8.5b, but as my old-boss pointed out, any new lawsuits or adjustments will result in something that will be stretched out to 3 years and be settled when everyone's forgotten about it. Thus, I have changed my unhedged short position to a straddle position. Any news will move the stock significantly, as the headlines will be significant (like Buffett falling asleep in the tub and deciding that he will invest in BAC after only 24 hours to review the company's books - it takes a full team roughly 3 days to have a good picture of a company, let alone one with so many illiquid and complex assets such as BAC). So far, so good.